Nasdaq Futures: The Significance of Friday's Doji and Potential Market Pullback for Bulls
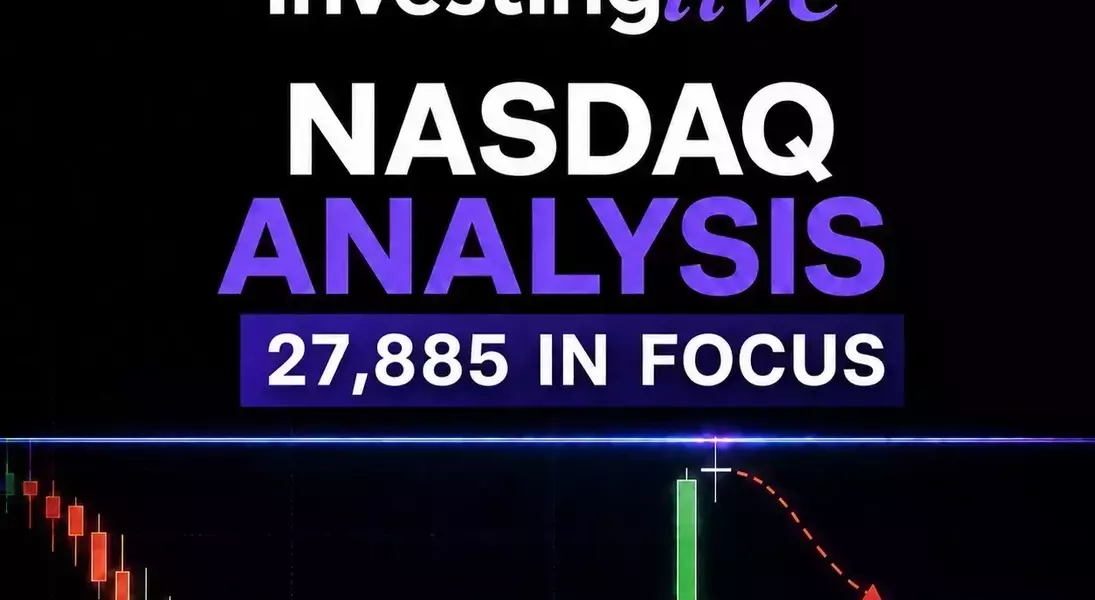
Navigating Uncertainty: Why a Doji Could Signal a Nasdaq Futures Reversal
Understanding the Recent Volatility in Nasdaq Futures
Following a robust 4% increase on Thursday, Nasdaq futures entered a period of indecision on Friday, characterized by the formation of a doji candlestick. This pattern emerged near significant resistance thresholds, specifically below the monthly value area low of 28,317 and the anchored Volume Weighted Average Price (VWAP) at 28,550. This suggests that despite Thursday's strong upward movement, a confirmed bullish reversal remains unverified, raising concerns about a potential market retraction.
Critical Thresholds for Nasdaq in the Upcoming Trading Period
For traders, several key levels demand close attention. A primary scenario points to a downward adjustment towards 27,885 in the immediate trading sessions. The main resistance zone lies between 28,317 and 28,550, with Friday's high and the previously breached channel in the 28,665 to 28,725 range presenting further hurdles. A sustained break below Friday's low of 28,080 would confirm initial bearish momentum. Should the market continue its decline, deeper targets at the 27,000 psychological level and the anchored VWAP standard-deviation support at 26,775 could come into play. Conversely, a bullish recovery would necessitate reclaiming 28,550 and maintaining positions above Friday's high to negate bearish outlooks.
The Strategic Importance of Friday's Doji Formation
A doji itself does not definitively forecast a price decline; rather, it signifies market equilibrium between buyers and sellers over a trading session. Its significance is magnified by its context. Appearing immediately after a substantial green candle and retesting the underside of a previously broken rising channel, Friday's doji suggests that former support might now act as resistance. For those anticipating a major bullish reversal after Thursday's rally, Friday's outcome lacked the necessary confirmation, hinting at persistent selling pressure.
Deciphering the Daily Nasdaq Chart
A closer look at the Nasdaq daily chart reveals Thursday's impressive nearly 4% rally from open to close, which typically excites bullish sentiment. However, Friday's doji, with an opening near 28,317 and closing at 28,287, indicated a profound lack of conviction from either side, highlighting a pause in momentum.
Analyzing Resistance Zones and Their Impact on Bullish Prospects
The market's rally stalled precisely at a confluence of critical resistance points. The retesting of the bear flag's underside, where old support transformed into new resistance, played a crucial role. Remaining below the anchored VWAP at approximately 28,550 reinforces the sellers' dominance in the broader market. Furthermore, a close beneath the monthly value area low (mVAL) at 28,317 implies that the market is currently rejecting higher valuations.
Forecasting Key Levels for the Next Trading Interval
Given the halt in momentum at resistance, the immediate outlook leans towards potential pullback areas before any robust recovery can materialize. The initial target for a retracement is around 27,885, positioned just above the midpoint of Thursday's large green candle. Markets frequently retrace into significant moves to gauge the willingness of buyers to defend these gains. Should prices fall past 27,000, deeper targets including the 1st standard deviation line below VWAP at 26,775, which typically serves as strong statistical support, become relevant for a major reversal.
The Significance of 28,317 and 28,550
The monthly value area low at 28,317, which coincided with Friday's opening, is a key reference point. When prices fail to reclaim this level after dipping below it, it signals that previous consensus on value is now acting as resistance. More importantly, the anchored VWAP at 28,550 signifies the average price traded since a chosen market event. Sustained trading below this level suggests that early buyers might be using rallies to reduce their exposure. A daily reclaim of 28,317 would be an initial positive sign, but a stronger bullish signal would be a close above 28,550 and a return inside the previously broken blue channel.
Mapping Potential Nasdaq Futures Outcomes
The primary bearish scenario involves a sustained trade below 28,080, targeting 27,885, followed by 27,000 and 26,775. This bearish outlook would be undermined by a reclaim and sustained acceptance above 28,550. Conversely, a bullish recovery is confirmed by reclaiming 28,317 and closing above 28,550, with targets at 28,665 to 28,725 and higher channel resistance. Failure to hold above 28,080 would weaken this recovery. A strong bullish reversal requires acceptance above Friday's high near 28,725 and a return within the channel, with higher resistance points requiring reassessment as the week progresses. A rejection below the channel would invalidate this strong bullish scenario.
Pinpointing 27,885 as a Key Retracement Level
The most likely short-term scenario suggests a minimum retracement towards 27,885. This level is slightly above the midpoint of Thursday's significant green candle. Large upward moves often see partial retracements as the market tests the commitment of buyers or if the rally was primarily driven by short covering. While 27,885 isn't necessarily a hard stop, it's the initial critical support area to observe if Friday's failure to continue upward transitions into renewed selling. If buyers successfully defend 27,885 and prices subsequently reclaim Friday's low, a more credible market base could form. However, acceptance below 27,885 would shift focus to the psychologically important 27,000 level, and further down, to 26,775, which represents one standard deviation below the anchored VWAP, as a potential bearish target before a significant bullish reversal.
Factors That Could Invalidate a Cautious Market View
The current cautious outlook, favoring a bearish retracement, would begin to dissipate if buyers manage to reclaim the monthly value reference at 28,317 and firmly establish prices above the anchored VWAP near 28,550. A mere brief intraday spike above VWAP would be insufficient. Ideally, bulls would need to demonstrate sustained price action above this level, defend any pullbacks, and ultimately close back within the previously breached channel. A move exceeding Friday's high near 28,725 would offer more compelling evidence that the channel rejection failed and that Thursday's rally was more than just a fleeting short-covering event. Until such confirmations emerge, the burden of proof rests with the bulls.
Strategic Approaches for Traders in the Upcoming Week
Nasdaq futures are currently positioned within a 'decision zone' defined by clear bullish and bearish confirmation levels, roughly between 28,080 and 28,550. Traders should exercise caution and avoid overreacting to every minor fluctuation within this range as a definitive directional signal. A break coupled with sustained market acceptance is far more significant than a brief touch or a stop-loss trigger at an obvious price point. For a more detailed understanding of confirmation, invalidation, and decision zones, traders are encouraged to consult resources like the investingLive tradeCompass market map.